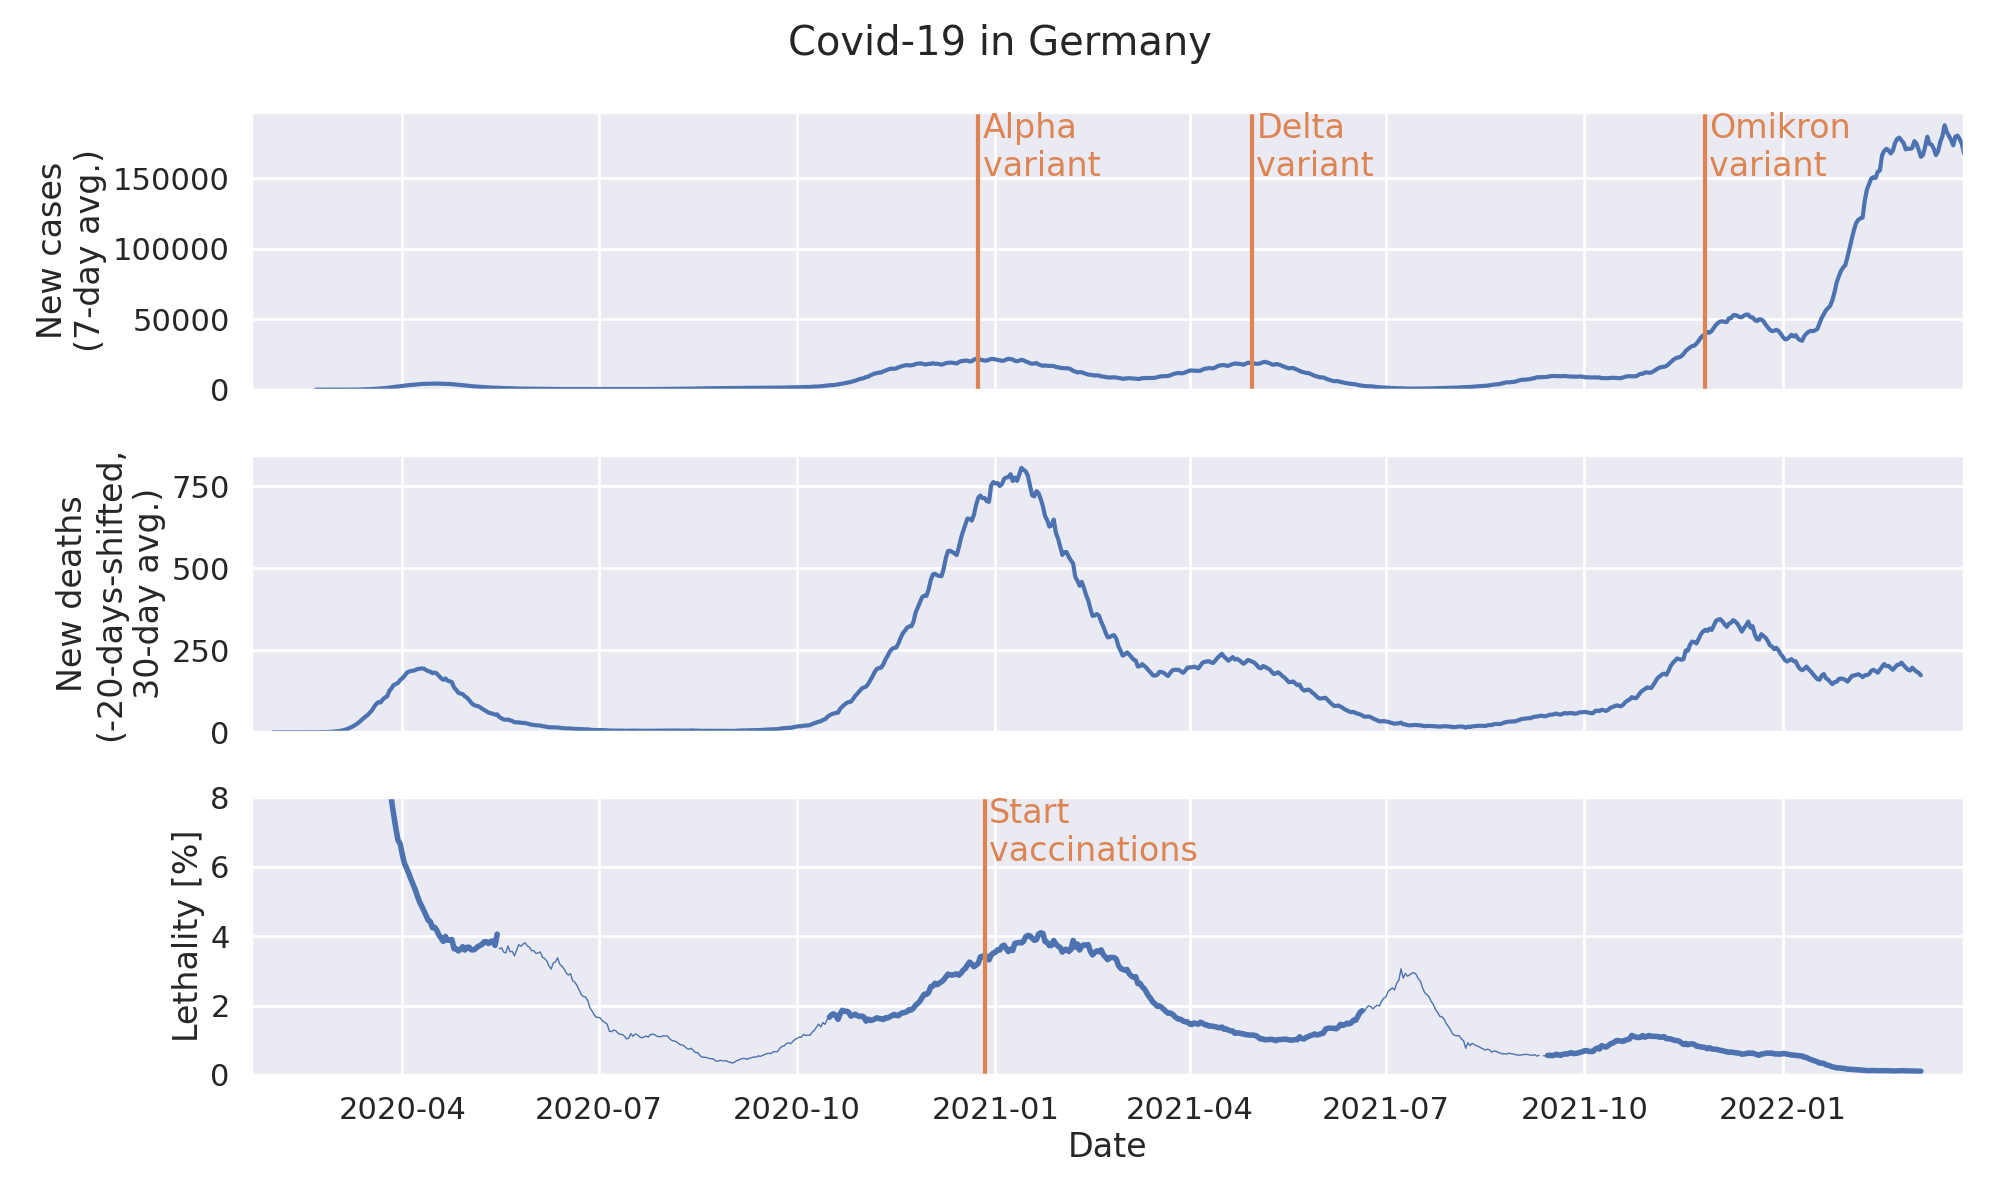
Covid: lethality over time
-
Data source: http://www.dkriesel.com/corona, referring to https://data.humdata.org/dataset/novel-coronavirus-2019-ncov-cases (retrieved 22/02/20)
-
Data visualized for Germany
-
Marked virus variant start dates are taken from https://www.rki.de/DE/Content/InfAZ/N/Neuartiges_Coronavirus/Virusvariante.html (retrieved 22/02/20).
These dates might not necessarily represent the date, where this variant "took off".
-
Marked date for vaccination start is taken from https://github.com/robert-koch-institut/COVID-19-Impfungen_in_Deutschland (retrieved 22/02/20).
-
The data is smoothed with a rolling average of 7 days.
-
According to https://journals.plos.org/plosone/article?id=10.1371/journal.pone.0257978, figure 1, the mean time between diagnosis and death is about 20 days.
Lethality is accordingly the ratio between deaths (time-shifted by -20 days) and cases.
This is obviously a very strong simplification.
-
Lethality is plotted with a thick line for periods, where the number of daily deaths was equal or larger than 50,
otherwise with a thin line.
I assume that the lethality value is not very representative for low numbers of deaths,
potentially because the estimate for the time between diagnosis and death is then not correct.
-
Effects like unreported cases e.g. due to exceeded lab capacities are not considered.
Main page